
Artificial Analysis Intelligence Index
Most fields on a gallery card describe the model itself, such as its attention type, layer mix, or KV-cache size. I added the Artificial Analysis Intelligence Index to provide a separate performance reference. It answers a different question. How did the released model score on a shared set of evaluations?
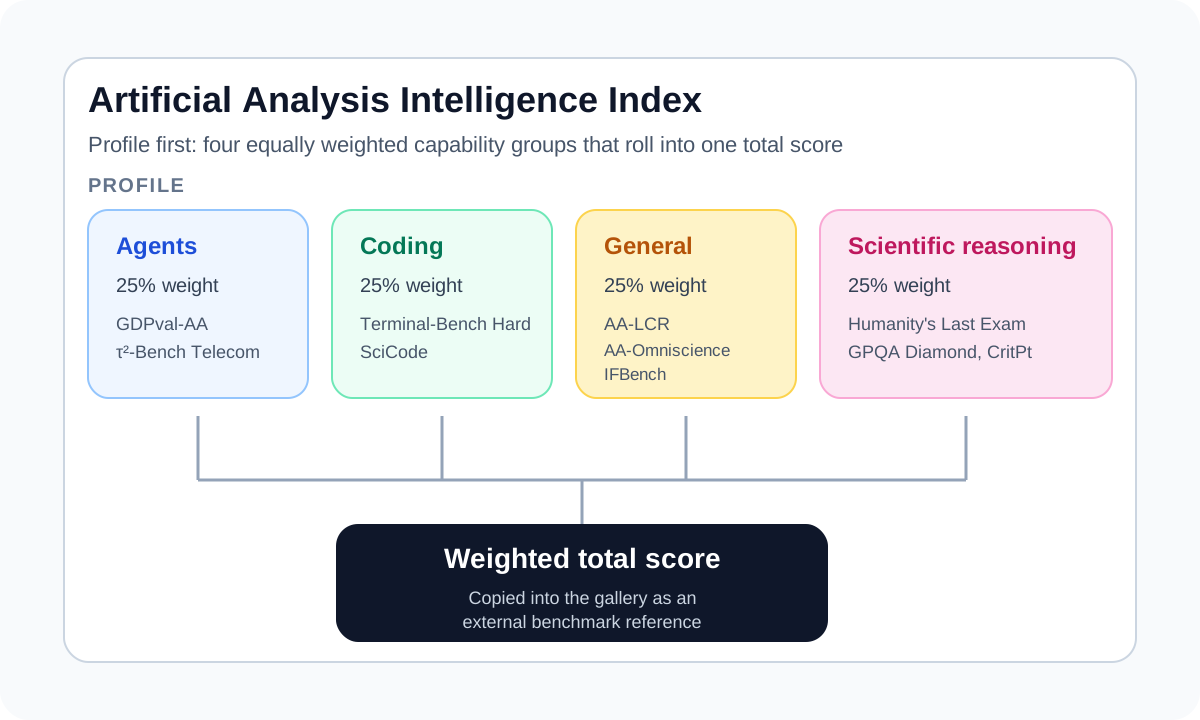
The card shows this information in two lines. Total score is copied from the matching Artificial Analysis model page. Profile is my compact diagnostic view across Agents, Coding, General, and Scientific Reasoning.
There is an important distinction between them. The total is the official Intelligence Index. The profile is specific to this gallery and should not be used to reconstruct the total.
Current method
Intelligence Index v4.1, a text-only English-language suite
Category weights
Agents 34%, Coding 24%, Scientific Reasoning 24%, General 18%
Gallery data snapshot
2026-09-30
What the two fields mean
Total score is the overall Intelligence Index shown on the matching Artificial Analysis model page. If that page reports an estimate while an independent evaluation is pending, the gallery records the estimate.
Profile is a second view that I added for quick comparisons. The Agents and Coding values use the corresponding Artificial Analysis subindices. General combines AA-LCR, AA-Omniscience, and IFBench. Scientific combines Humanity’s Last Exam, GPQA Diamond, and CritPt.
This makes the profile useful for spotting uneven results, but its four numbers are not the four weighted category values used by Index v4.1. For example, the gallery snapshot for DeepSeek V3.2 records a total of 24.7 alongside General 29.7, Scientific 24.2, Coding 34.6, and Agents 39.8. Applying the v4.1 category weights to those four profile values will not produce 24.7.
I keep the profile because two models with similar totals can still look quite different on coding or agent tasks. It is a directional comparison rather than another official Artificial Analysis index.
What goes into v4.1
Artificial Analysis introduced Index v4.1 in June 2026. It is a weighted average of nine evaluations grouped into four categories:
- Agents, 34%. GDPval-AA v2 contributes 20%, and τ³-Banking contributes 14%.
- Coding, 24%. Terminal-Bench v2.1 contributes 16%, and SciCode contributes 8%.
- General, 18%. AA-LCR contributes 6%. AA-Omniscience supplies an 8% accuracy component and a 4% non-hallucination component.
- Scientific Reasoning, 24%. Humanity’s Last Exam contributes 12%. GPQA Diamond and CritPt contribute 6% each.
Version 4.0 used a different recipe. It gave each category 25%, used Terminal-Bench Hard and τ²-Bench Telecom, and included IFBench. Artificial Analysis still reports IFBench separately, but v4.1 leaves it out of the official total. The gallery Profile continues to include IFBench in its General diagnostic, which is another reason not to treat Profile as a decomposition of the total.
Why the snapshot date matters
Artificial Analysis revises both benchmark composition and model results. For that reason, the gallery stores the date of its data pull. The current snapshot on this page is 2026-09-30.
The date matters in model comparisons. Scores collected under different index versions may reflect changes in the evaluation suite as well as changes in the models. When a matching model page or a required field is unavailable, the gallery displays N/A instead of filling the gap with an estimate.
What the score can tell us
I use the index as a broad check on a model release. A score difference cannot identify which design choice caused it. Training data, post-training, tool use, reasoning settings, and test-time compute can all influence the result alongside architecture.
The v4.1 suite focuses on text-only, English-language tasks. Artificial Analysis evaluates multimodal and multilingual capabilities separately, so those capabilities are outside this number. Artificial Analysis also reports that the 95% confidence interval for the overall index is smaller than ±1%, while intervals for individual evaluations may be wider.
For architecture comparisons, I therefore use the index as supporting context. The architecture fields and the original technical report remain the better sources for understanding how a model is built.